Late-August Heat Lifts Power Prices
Pricing Signals
Natural-gas production has increased to 109.7 Bcf/d, while LNG exports have risen to 17.9 Bcf/d. Export volumes have not operated at full capacity over the past month or two, though both Freeport LNG and Plaquemines LNG increased activity last week.
Looking ahead to winter, most months appear favorably priced relative to January, which remains above $80/MW. At this point last year, Winter 2026–2027 pricing traded roughly $3–$5 lower than current levels. However, future shoulder-month pricing is at or below where it traded a year ago.
Natural Gas Storage and Supply
What to Do Now
A managed index electricity agreement simply sets the framework for purchasing blocks of energy in the future, locking in only those parts of your rate that you decide to lock in such as capacity, line losses, etc. At any time, you can buy up blocks of energy or even lock in the entirety of the contract if the hedged rate is low enough. Look forward for opportunities such as 2029 where pricing for March through May and September through November are less than $50.00 per MWh. Look at hedging December, February, March and April. Taking 50% of those months at today’s prices is a pretty solid bet. Hold off on January. We are projected to have a strong El Nino this winter and that should bring pricing down.
When you look at your energy strategy, don’t just look at the price you are paying or the strategy you are using. Those are important, but just as important are the measures you take to reduce the amount of energy you use in the first place. You can find the best electricity rate available, but an inefficient HVAC or old lighting will more than wipe out any savings you might achieve by increasing the amount of electricity you use. The old saying “The cheapest electricity you have is the electricity you don’t use”, still holds true. Talk to an energy expert about getting a free site audit done at your facility.
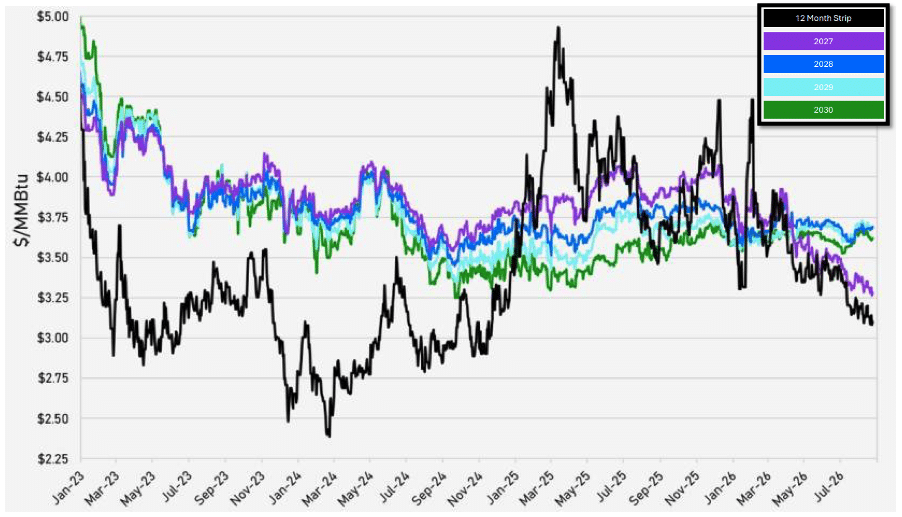
NYMEX Natural Gas Calendar Strips
The NYMEX 12-Month Strip averages the next 12 months of Henry Hub futures into one price. It’s a powerful indicator of market sentiment — allowing traders (and end users) to lock in year-long coverage at a blended rate.
Watching shifts in this strip helps gauge the broader direction of gas markets, beyond just the prompt month.
Natural Gas Production: Lower 48 States
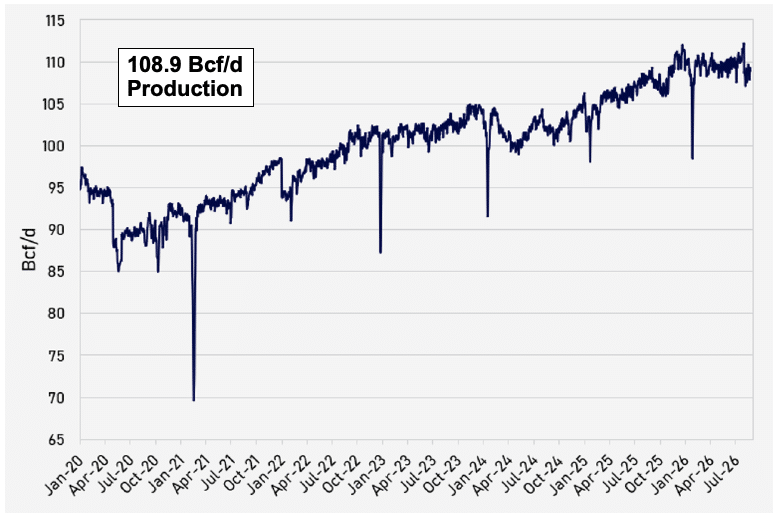
Production Snapshot
Weather Outlook
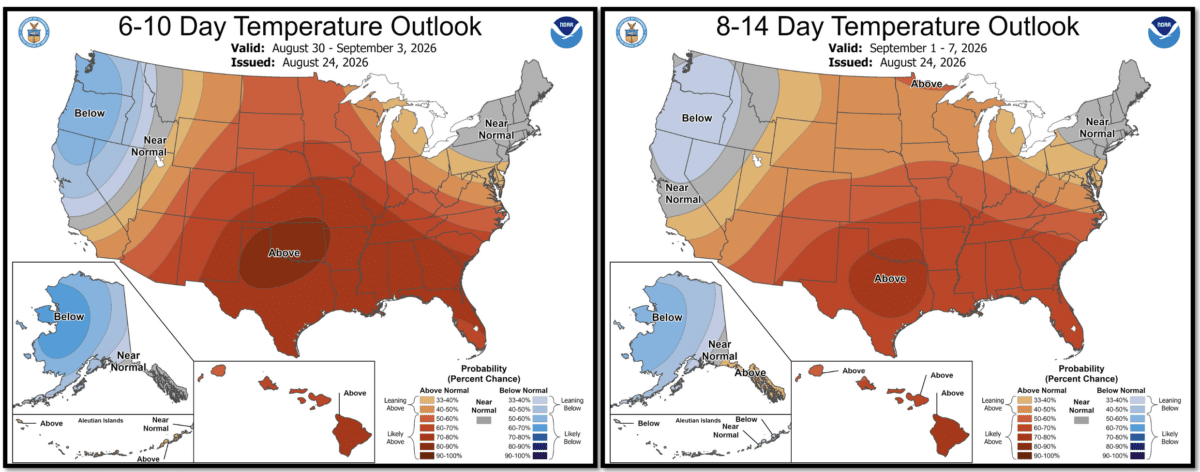
7-Day Weather & Demand Outlook
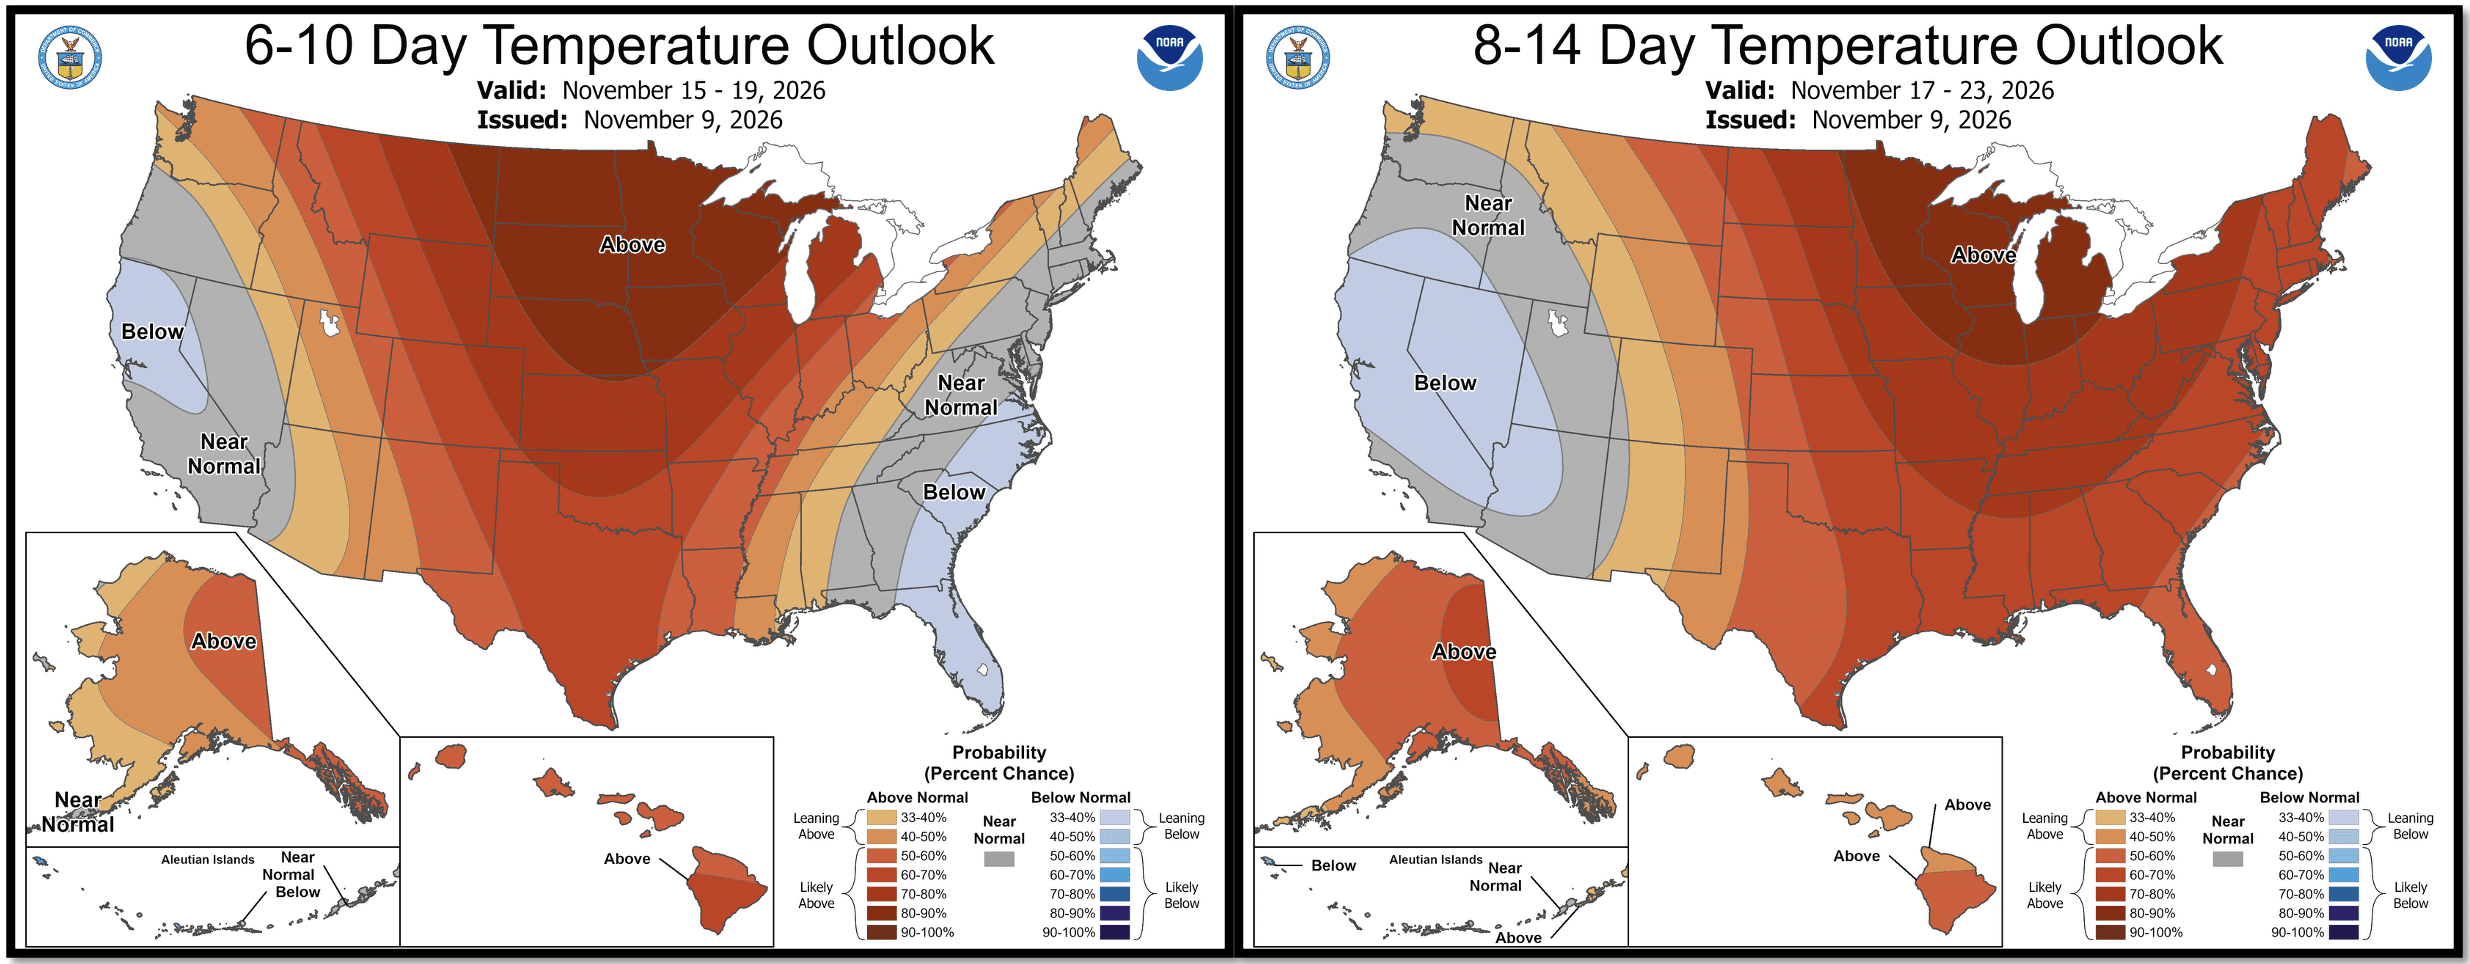
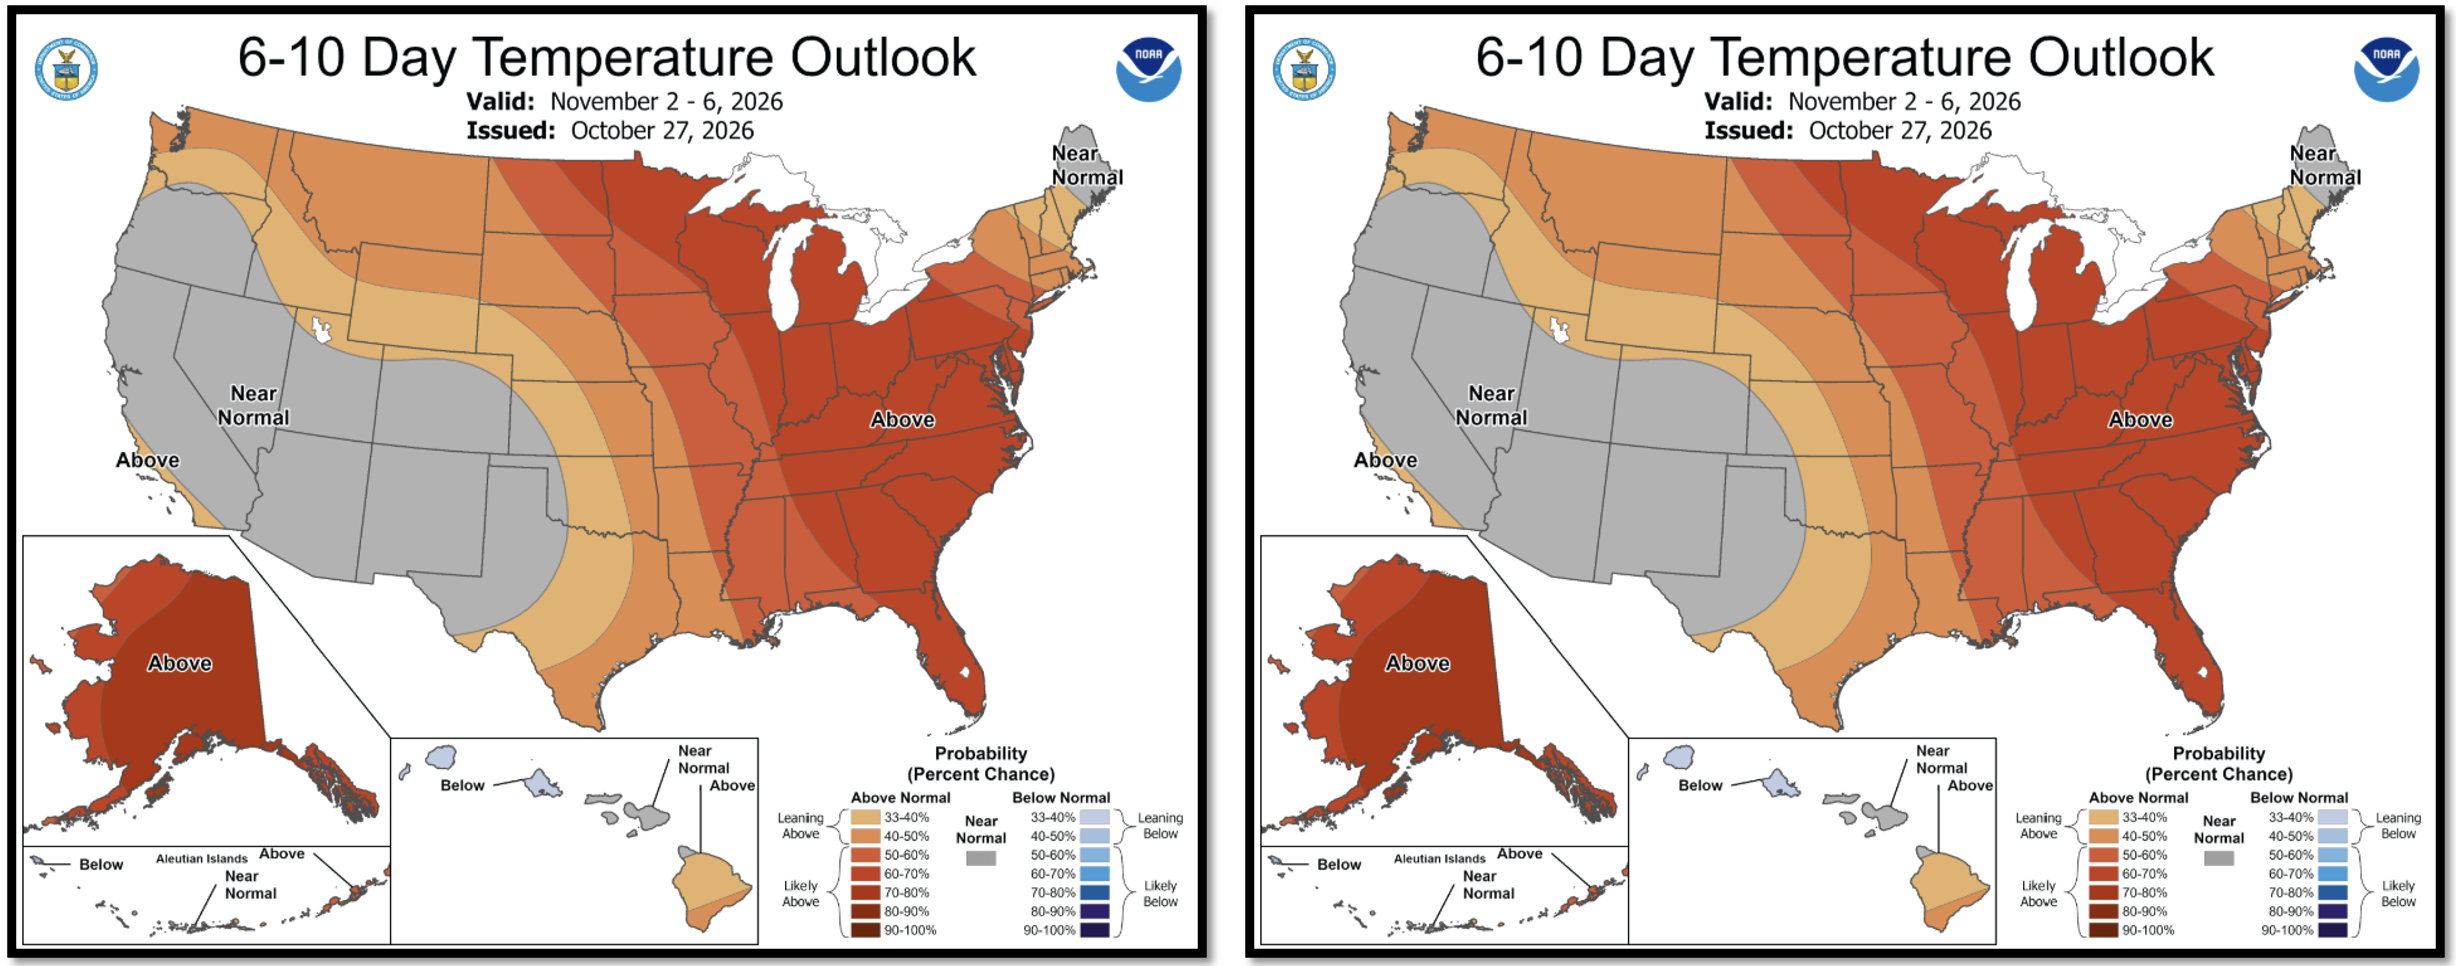
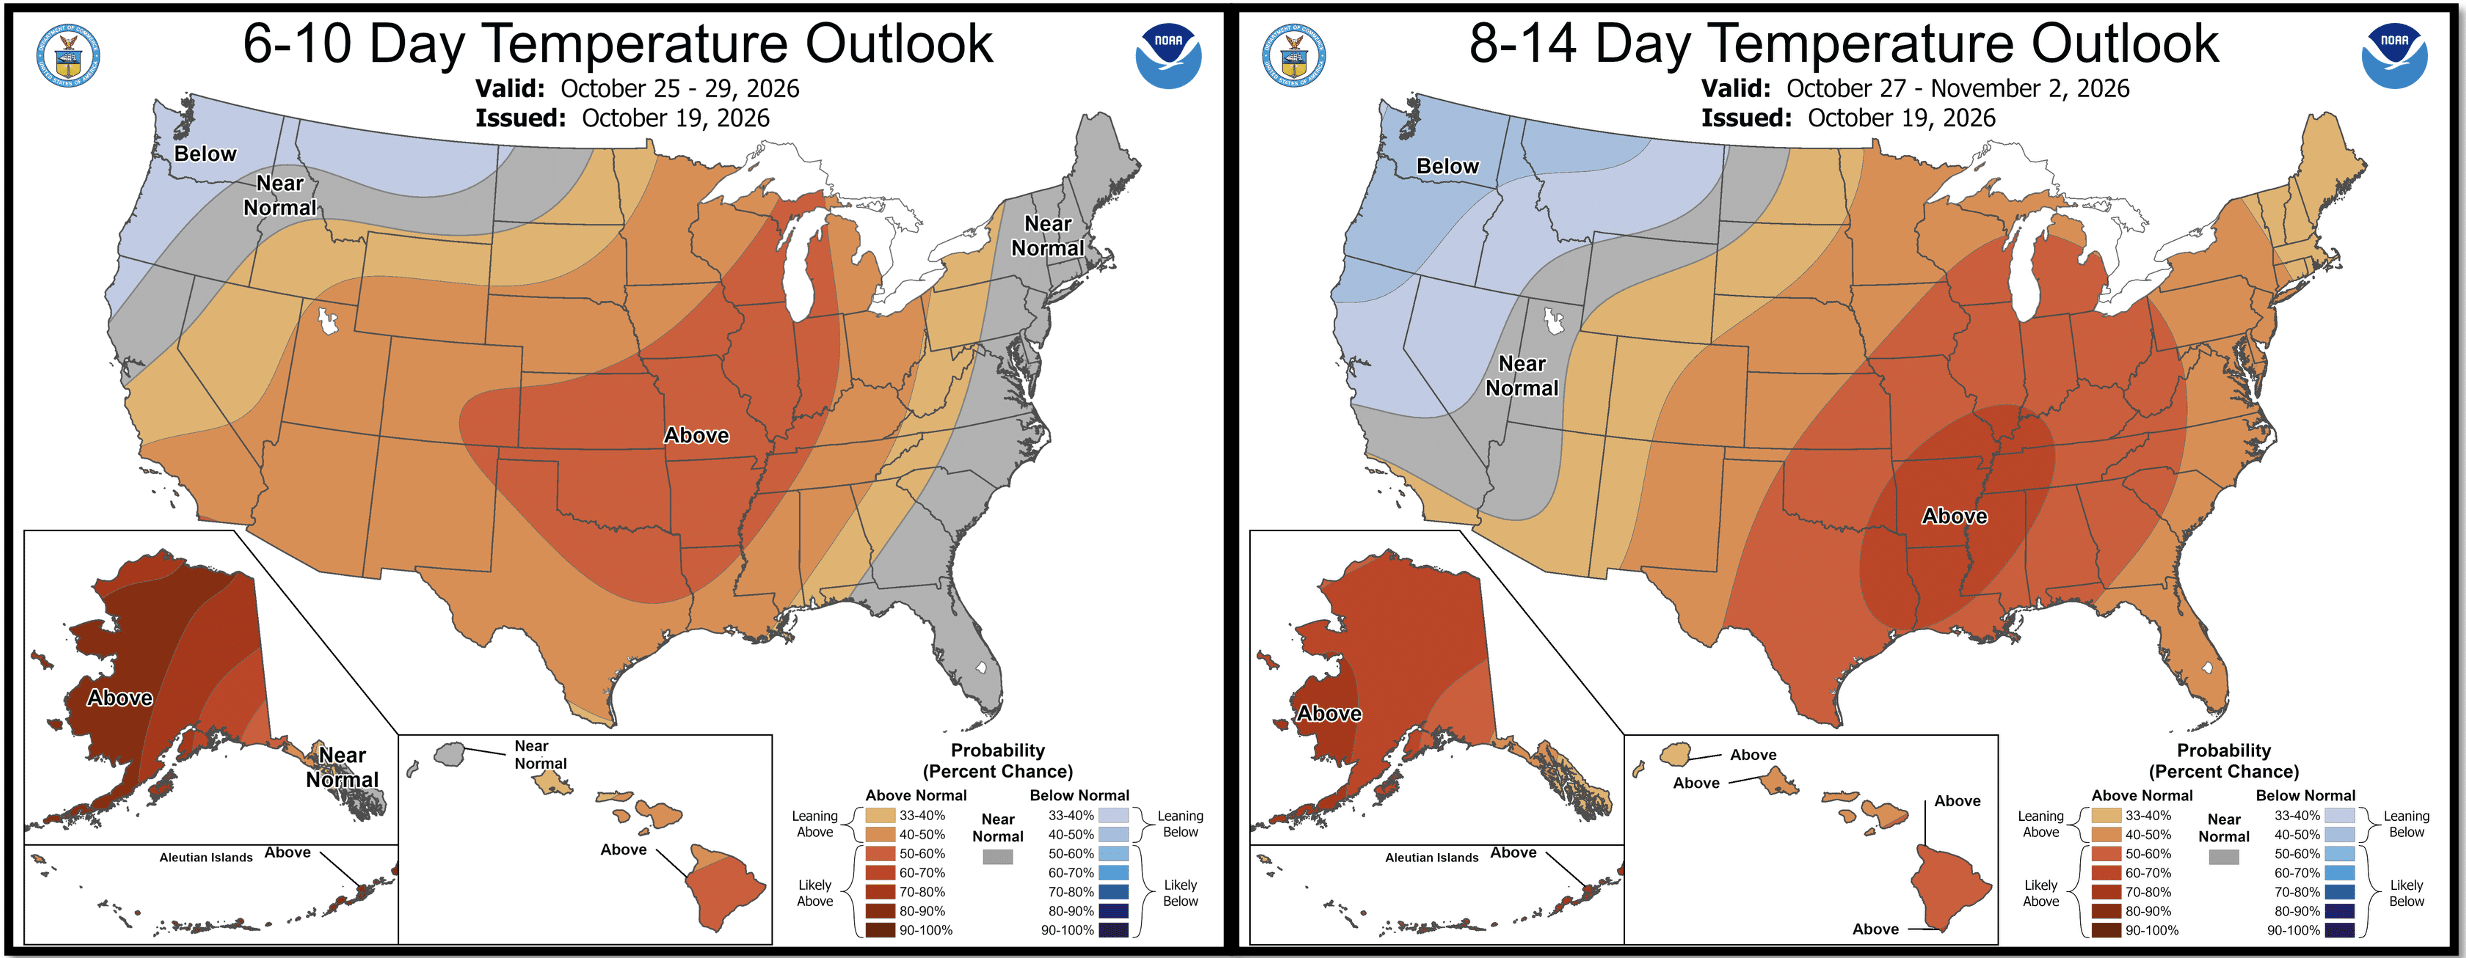
Forecasts continue to indicate above-normal temperatures across much of the western United States. Meanwhile, seasonal temperatures are expected across the East and South in the near term, with warmer conditions projected to expand into the southern regions next week. Warm conditions are expected to continue across the Plains into early and mid-September, led by the strongest heat in Texas, while much of the East remains near seasonal temperatures.
PJM Ad Hub DA & Forward Trend Analysis
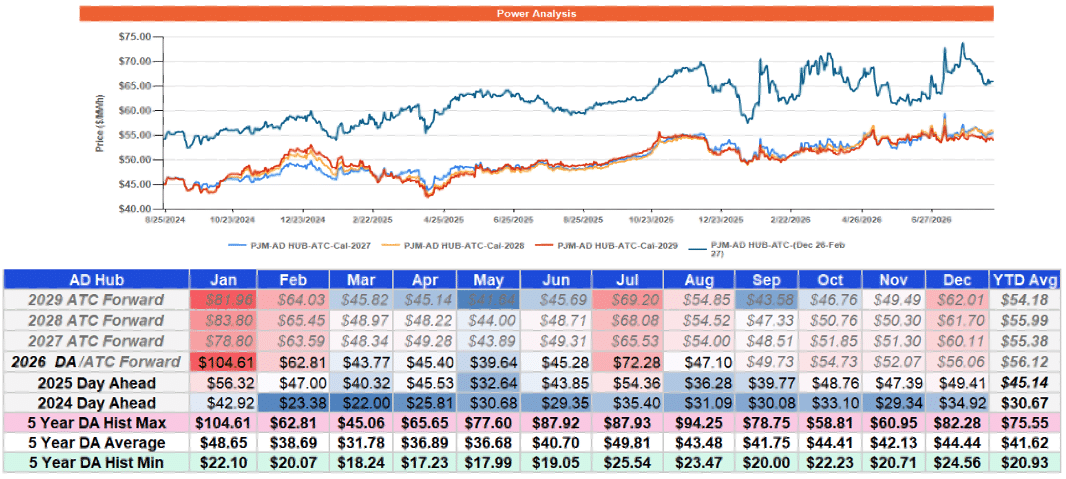
This chart shows where current PJM AD Hub day‑ahead and forward power prices sit versus the past two years of trading, and whether today’s levels look cheap or expensive for each future period.
Big picture
- Each bar represents a 24‑month trading range for a specific month, quarter, or year in the future, with the light blue band showing the lowest and highest prices over the last 2 years.
- The dark mark inside each bar is today’s forward price, so you can instantly see if the market is currently near the top, middle, or bottom of its recent range.
What the table tells you
- The table underneath lists, for each period (Q2‑2026, Q3‑2026, 2027, 2028, 2029, 2030, etc.):
- Current price in that strip.
- The maximum and minimum prices over the last 24 months and the dates they occurred.
- The current percentile (for example, 3% means today is near the very bottom of the 2‑year range; 86% means it’s near the top).
- The actual prices at the 25th, 50th, and 75th percentiles act like “cheap / mid / rich” reference points.
How to interpret it for decisions
- Periods where the current price is low on the bar and at a low percentile suggest relatively attractive buying or hedging opportunities compared with recent history.
- Periods where the current price is high on the bar and at a high percentile indicate the market is pricing that future strip richly, so you may want to be more cautious about locking in too much volume there.
NYMEX Price Trend Analysis
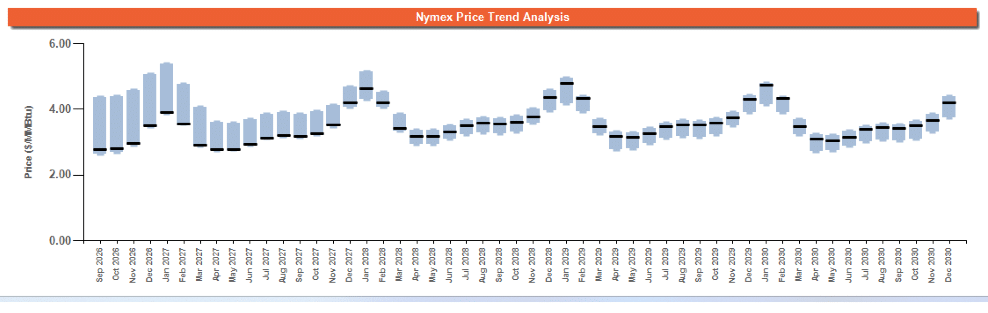
This chart shows that NYMEX natural gas prices over the next several years are relatively low compared with their recent trading range, but they remain volatile and tend to spike in winter months.
What the chart is basically saying
- It is a forward curve: each bar represents what the market today thinks gas will cost in a specific future month, based on NYMEX futures trading.
- The light blue “24M trading history” band around each month shows the range in which that contract has traded over the past two years, and the black line shows today’s price within that range.
- For many future months, today’s price is near the bottom of that 2‑year range (a very low percentile in the table), indicating the market is currently pricing gas on the cheaper side compared with recent history.
Big-picture energy market takeaway
- The curve gently rises over time and bumps up in winter (late 2026, 2027, 2028), reflecting expectations of stronger heating demand in cold months and the typical seasonal risk in natural gas.
- Because today’s prices sit near recent lows for many of those future periods (single‑digit to low‑double‑digit percentiles), the market is not currently forecasting a severe supply crunch; instead, it suggests adequate supply and only moderate risk premiums built in.
- For a business buyer, the practical implication is: forward prices are historically attractive right now, especially if you want to lock in budget certainty through the next several winters rather than gamble on future spikes.