Natural Gas Storage and Supply
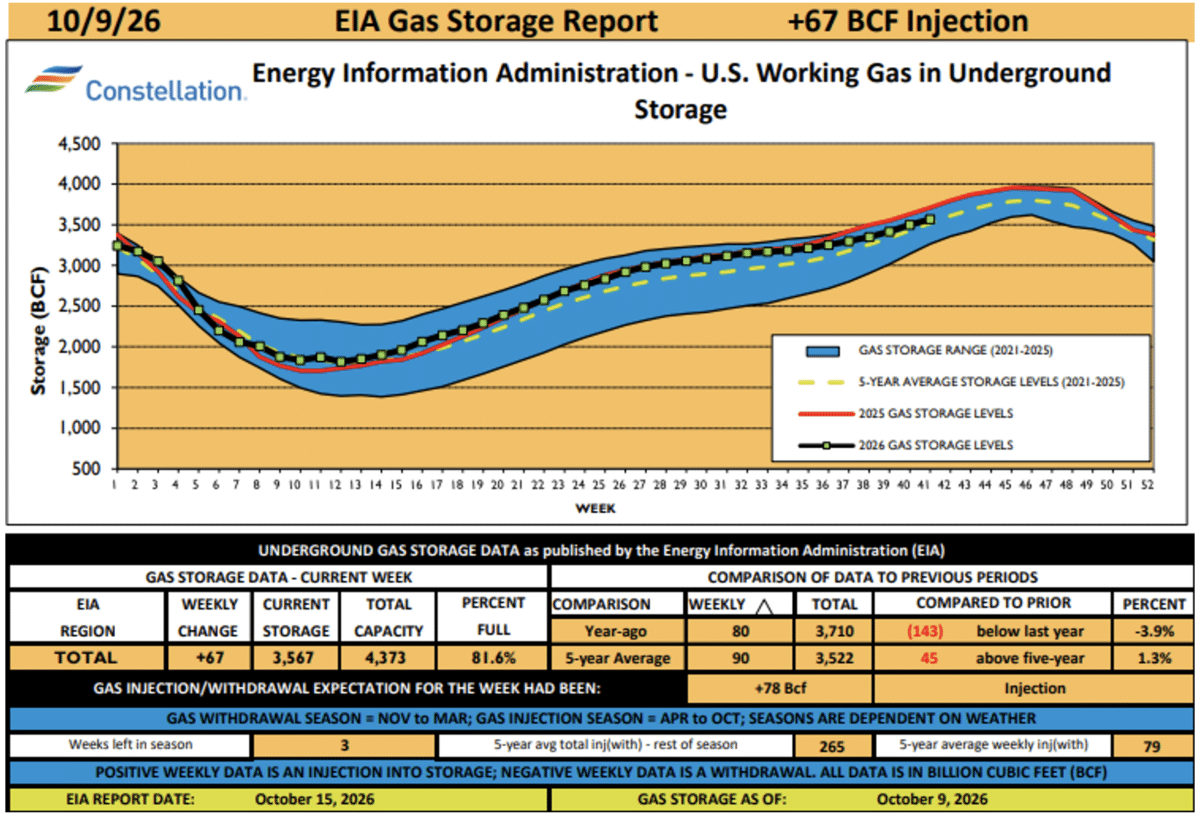
- An injection of +67 Bcf was below expectations and makes nine straight weeks gas injections have been below the five-year average.
- In Natural Gas, the year is divided into Injection season, which runs from April 1st through the end of October, and Withdrawal season, which runs from November 1st through the end of March.
- We are dangerously close to slipping below the five-year average in natural gas storage, just 1.3% above it, and if we do fall below, that could definitely impact gas pricing.
What to Do Now
- If you are using more than a million kWh annually, talk to your energy advisor about moving to a Load Following Index strategy or Managed Index strategy. This strategy allows you to buy blocks of energy when it is favorable and let the rest stay on the Day Ahead index rate. This is an excellent strategy that eliminates the premiums suppliers often place on the components of your electricity rate when they must fix it.
- Look at longer term agreements to allow you take advantage of lower blocks of energy in the future. 2029 is currently priced below market expectations. You may want to think about locking up 50-75% of the off-peak months or even locking up 75% of all but Winter 2029. It might be advisable to also hedge 25% of the coming January & February and then look at it again just before Thanksgiving. If it remainsthis low, look at locking up another 50%.One winter event can ruin pricing for the winter. Last winter saw mild temperatures in December, but a cold front that kept temperatures below freezing for much of the PJM for 15 days straight sent pricing over $120.00 per MWh. Hedging 25-75% of next winter helps mitigate any random weather events as well as taking advantage of some low pricing currently available.
- Natural Gas users should be on what is called a NYMEX+ strategy. This generally provides greater savings than a fixed all-in contract. A NYMEX+ strategy takes an ‘adder’ that covers the suppliers’ costs for storage and the cost of doing business in that utility and adds it to the NYMEX settlement price for that month. So, if you have an ‘adder’ of $0.75 cents per Mcf and place that upon last years NYMEX Settlement price of $3.004, you will have a rate of $3.754 for that month. Much better when you consider fixed pricing for gas currently does not go below $4.50 per Mcf.
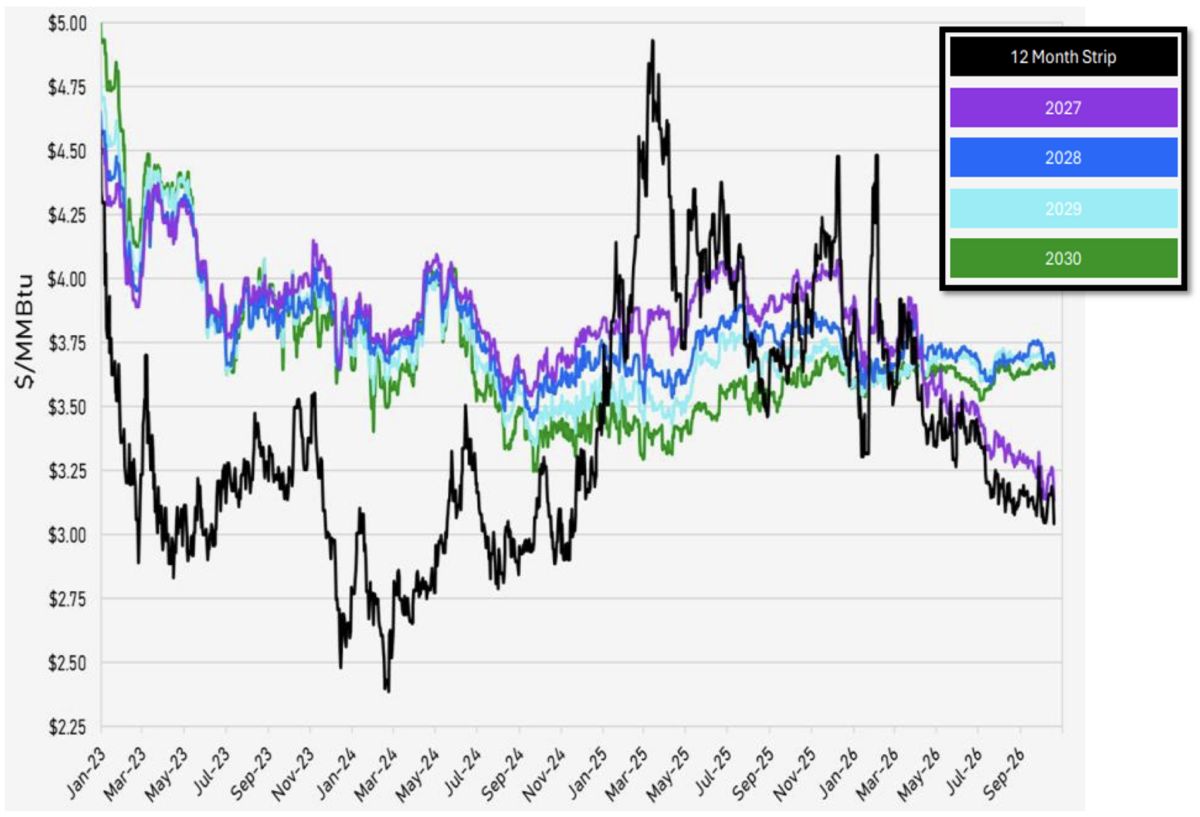
NYMEX Natural Gas Calendar Strips
- The 2026 Calendar Strip has remained low in large part due to the onset of the El Nino in May. This El Nino is now expected to remain strong through the early months of 2027, which has helped bring down 2027 pricing as well.
- Pricing in later years has begun to diverge from 2026 and 2027 as 2028, 2029 and 2030 have begun to cycle upward closer to $4.00
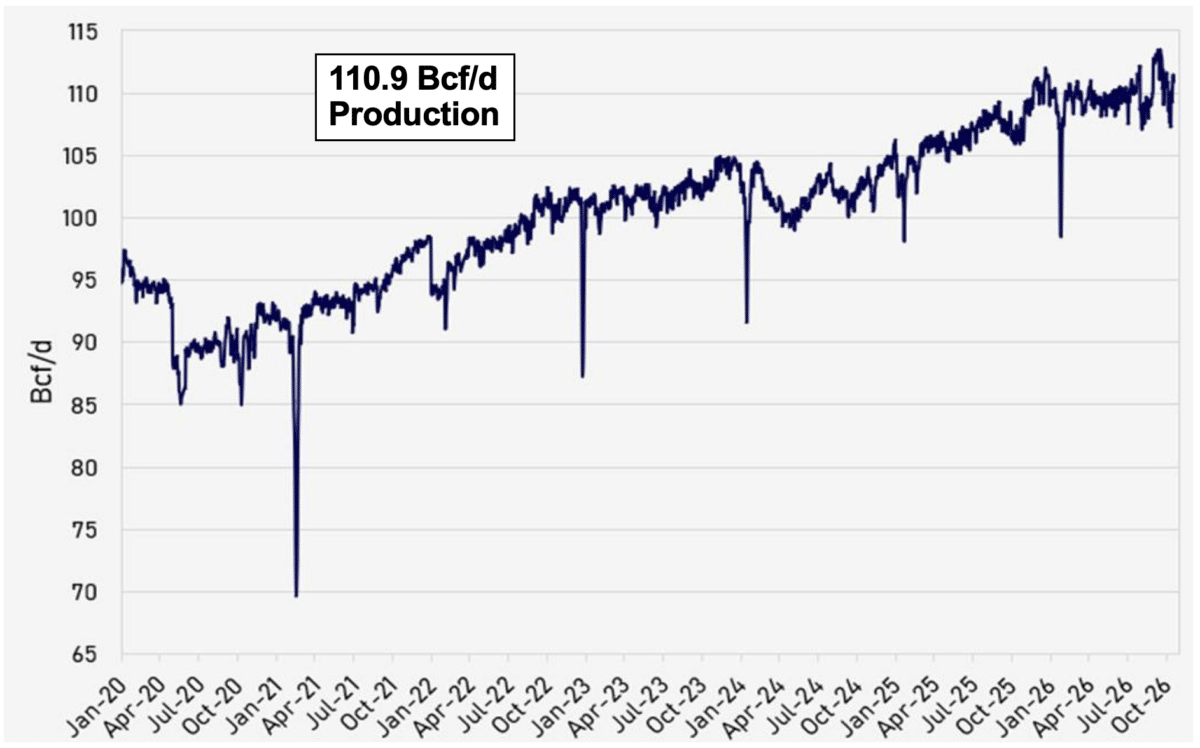
Natural Gas Production: Lower 48 States
Production Snapshot
The pricing for the 12-month strip and for 2027 continue to cycle lower with pricing hovering right around $3.00. While this winter is seeing lower pricing, 2028, 2029 and 2030 are all trending higher. This should prompt buyers to lock in now for as long as possible.
- Natural Gas production rose sharply from 107 Bcf/d to almost 111 Bcf/d, which would be close to a record.
- While production has been historically high in recent weeks, production will still have to increase to meet the demand that will be caused by the opening of more LNG Export facilities.
Weather Outlook
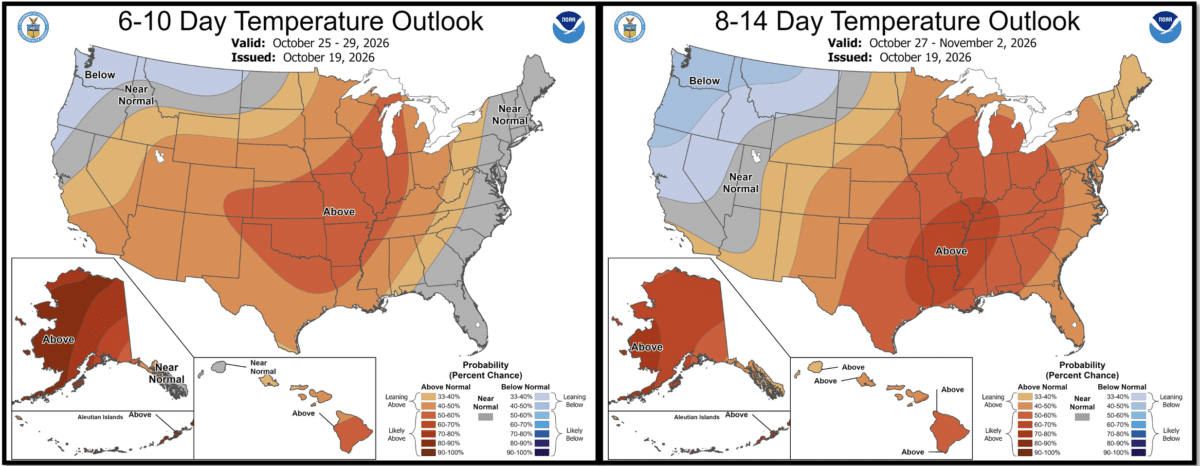
7-Day Weather & Demand Outlook
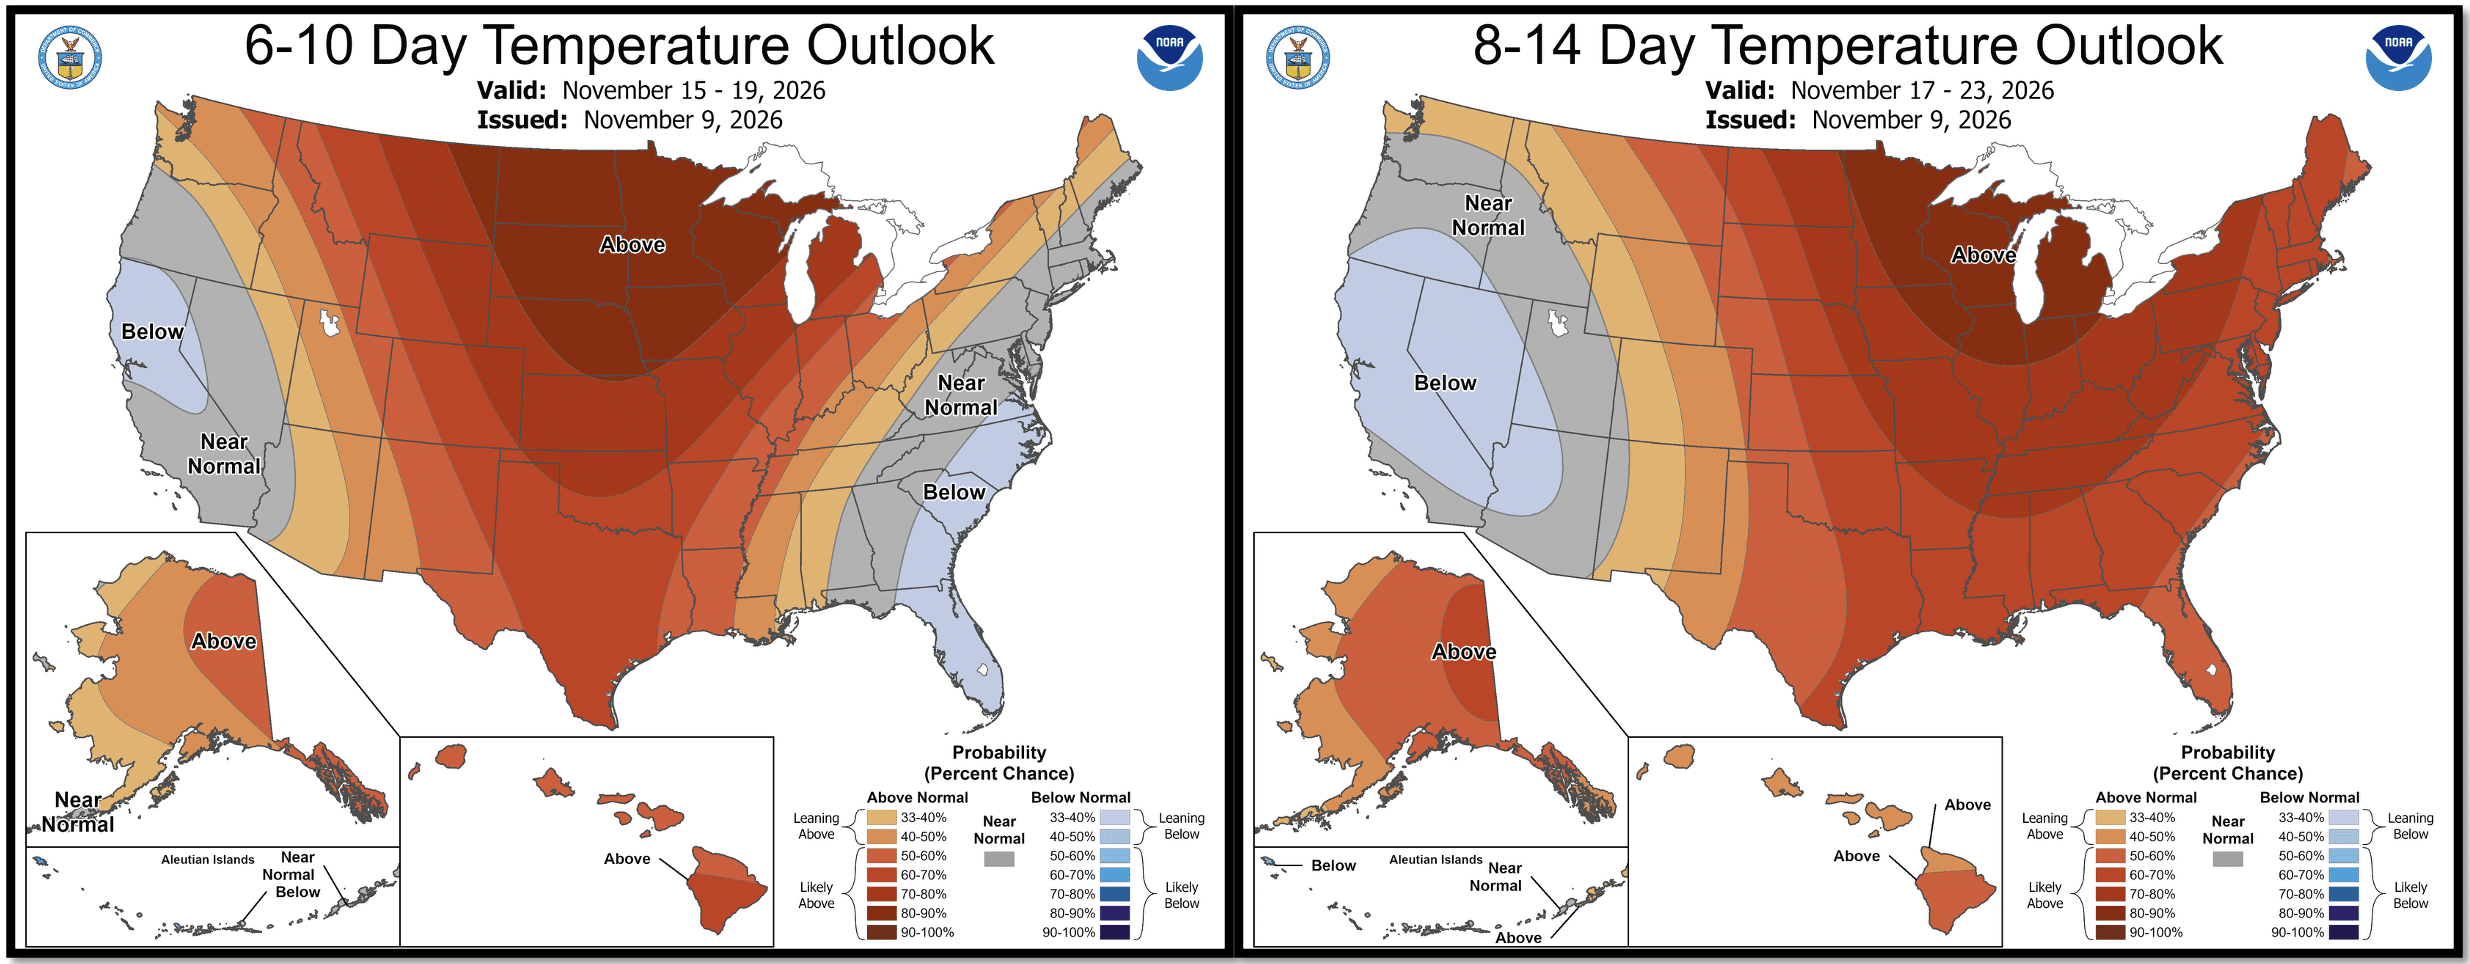
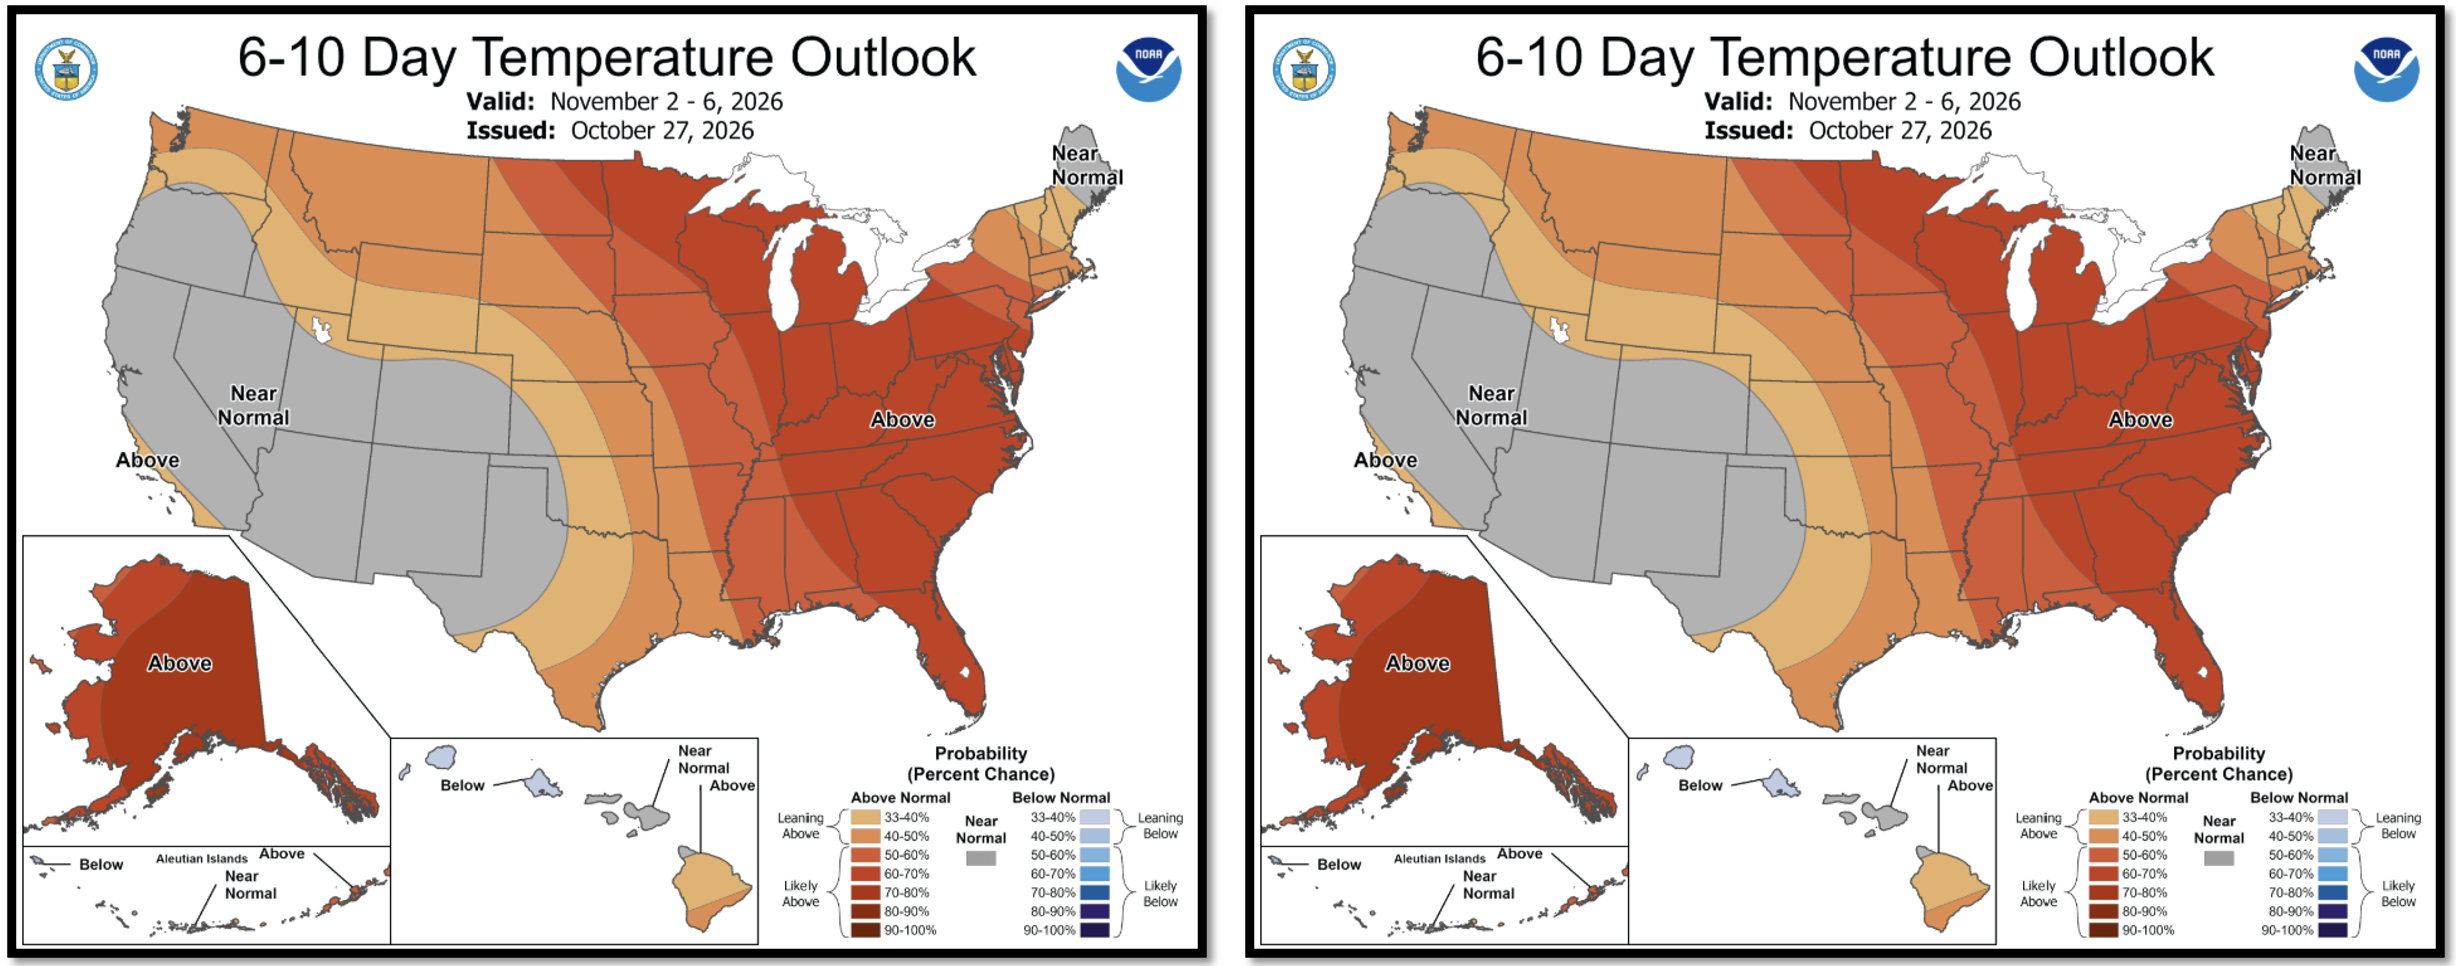
Warmer than normal weather continues to hover over the Midwest and Southwest moving ever so slowly eastward. This will create higher electricity demand, especially in the Deep South where temperatures are still reaching highs of eighties along the Gulf Coast and even into the 90’s in the Southwest. Cooler weather is behind this high-pressure area with colder weather in parts of Washington and Oregon.
PJM Ad Hub DA & Forward Trend Analysis
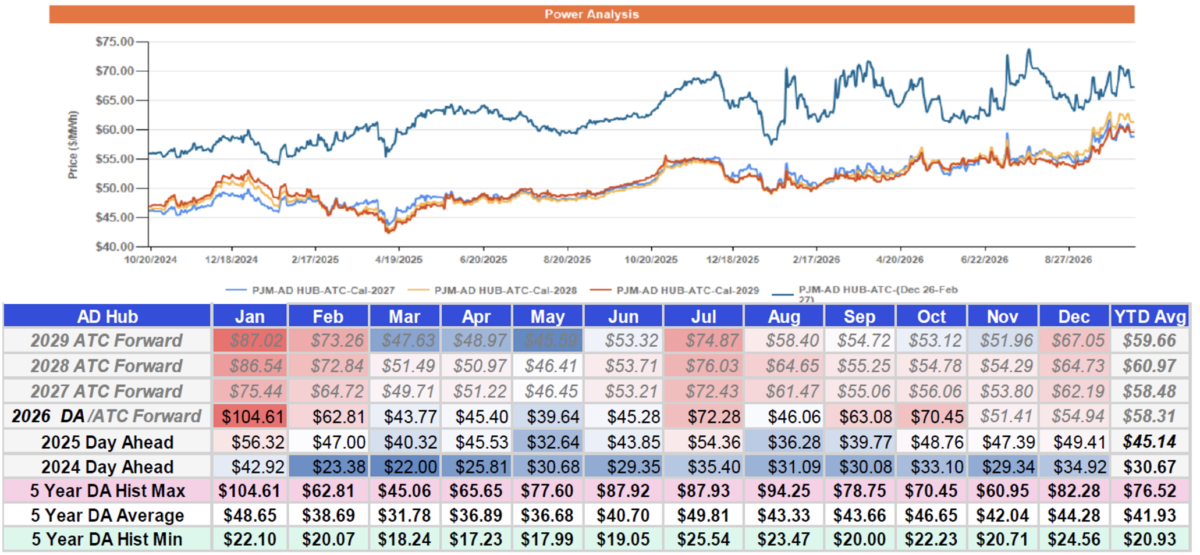
This chart shows where current PJM AD Hub day‑ahead and forward power prices sit versus the past two years of trading, and whether today’s levels look cheap or expensive for each future period.
Big picture
- Each bar represents a 24‑month trading range for a specific month, quarter, or year in the future, with the light blue band showing the lowest and highest prices over the last 2 years.
- The dark mark inside each bar is today’s forward price, so you can instantly see if the market is currently near the top, middle, or bottom of its recent range.
What the table tells you
The table underneath lists, for each period (Q2‑2026, Q3‑2026, 2027, 2028, 2029, 2030, etc.):
- Maintenance, scheduled and unscheduled has put a real jolt into pricing with the prompt month trading at over $70.00 per MWh. Pricing is still lower in most of 2029 and the shoulder months in early 2028 are looking pretty low as well, especially when you consider the possible effect that AI Data Centers may have in 2028-2029.
- The 2029 opportunities we have recommended are beginning to disappear. Hedging 25-30% in March-June 2029 is still a viable option, but September through November is already back over $50.00.
- Even with the slight increase, locking up most of 2029 is a good play at this stage.
How to interpret it for decisions
- Periods where the current price is low on the bar and at a low percentile suggest relatively attractive buying or hedging opportunities compared with recent history.
- Periods where the current price is high on the bar and at a high percentile indicate the market is pricing that future strip richly, so you may want to be more cautious about locking in too much volume there.
NYMEX Price Trend Analysis
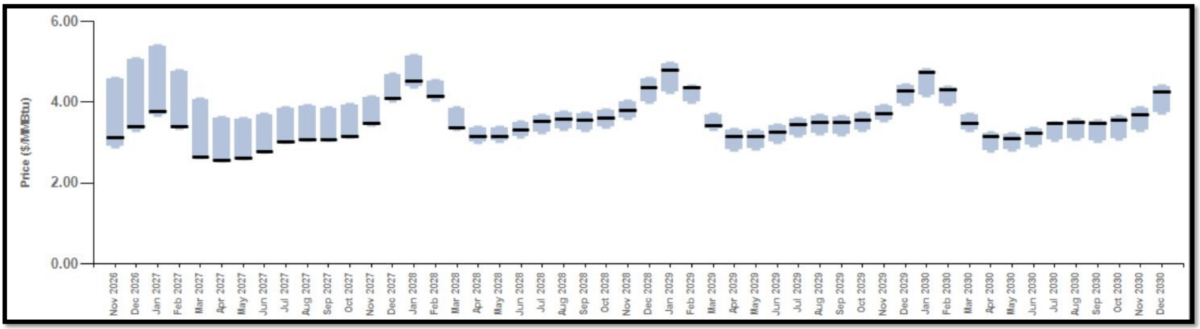
This chart shows that NYMEX natural gas prices over the next several years are relatively low compared with their recent trading range, but they remain volatile and tend to spike in winter months.
Key NYMEX Insights
Gas futures are currently trading at their lowest point in the last 24-months all the way through June of 2028. June of 2028 is the point where the trading history moves from trading at its lowest point in the last 24 months to trading closer to its highest point. This increase in the historical low trading range continues to expand farther into the future.
AI data centers will continue to drive extra demand for the foreseeable future. Several legislative bills are under consideration to limit these data centers impact on the local grid, but there is no consensus on whether these bills will have any impact.
Big-picture energy market takeaway
- If you are buying your Natural Gas in blocks, like a managed index electricity program, buying up blocks of natural gas in 2027 makes a lot of sense as 2027 is trading at three-year lows despite expected growth in demand.
- Look at locking up long term, at least through 2029 as pricing has moved lower across the board. Except for the future winters, gas is trading below $4.00 for most of the following years, but it is not expected to stay there.
- AI data centers will continue to drive extra demand for the foreseeable future. Several legislative bills are under consideration to limit these data centers impact on the local grid, but there is no consensus on whether these bills will have any impact.